Edit chart
Loading graph
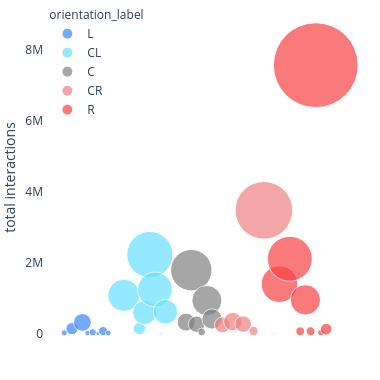
Jc_medina's interactive graph and data of "L, CL, C, CR, R" is a scatter chart, showing L, CL, C, CR, R; with total interactions in the y-axis. The x-axis shows values from 0 to 0. The y-axis shows values from 0 to 0.